Bitcoin set for largest historical move after rare breakout indicator is realized
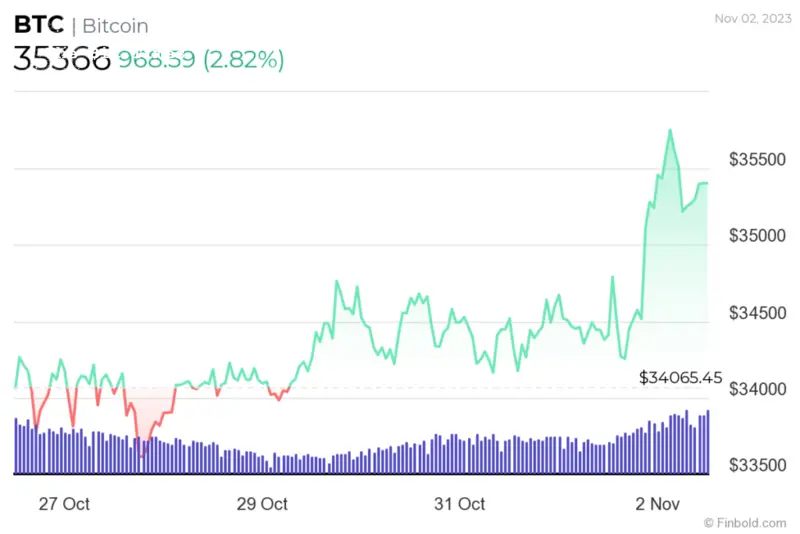
With Bitcoin (BTC) undergoing a short-term rally that has propelled the asset to surpass the $35,000 mark, attention has shifted towards how long this surge will be maintained as the asset aims for the next all-time high.
In this context, cryptocurrency analyst CryptoCon, in an X (formerly Twitter) post, pointed out that Bitcoin has recently encountered a rare breakout indicator, suggesting the potential for a significant historical move.
According to CryptoCon’s assessment, the indicator characterized by short-term downtrends and breakouts has only occurred for the second time in the current cycle, making it an event of exceptional significance.
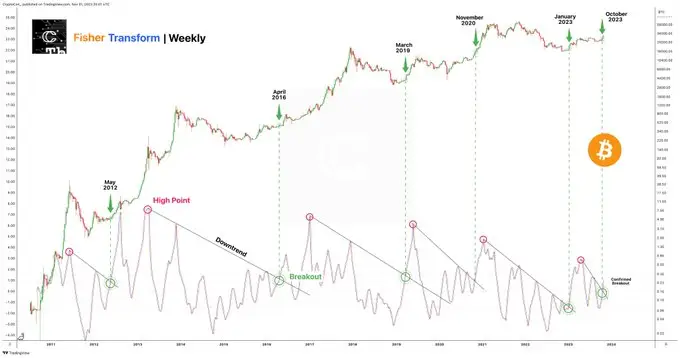
Historically, such occurrences have heralded significant movements in the cryptocurrency market and have been associated with some of the most notable bull runs in Bitcoin’s history.
![]() Cryptocurrency
CryptocurrencyBitcoin hits yearly high, $37,000 next target, says crypto analyst
![]() Finance
Finance‘Rich Dad’ R. Kiyosaki: People are addicted to cash, saving ‘paper’ makes no sense
![]() Cryptocurrency
CryptocurrencyMachine learning algorithm sets Solana price for November 30, 2023
![]() Cryptocurrency
CryptocurrencyTRON emerges as go-to blockchain for stablecoin transfers
![]() Banking
BankingHSBC ramps up its blockchain efforts with tokenized treasury transactions
“Not only does this typically spell good things to come in the shorter term, but it also marks the beginnings of all of the largest historical moves,” he said.


The breakout indicator is seen as a positive sign not just for the short term but also as the precursor to the beginnings of key historical moves in BTC’s trajectory.
Historical rallies
Based on the Analysis, some of the previous instances include the bull run from 2012 to 2013, the surge in 2016 to 2017, the 2019 parabolic rise, and the bull run from 2020 to 2021. The first surge of 2023 has also been attributed to this indicator.
Market experts are anticipating what could potentially be the next monumental move for Bitcoin. While there may be speculation about a possible short-term dip, analysts believe the long-term trajectory is poised for significant growth.
It is worth noting that Bitcoin’s current rally was fueled by news regarding the potential launch of a spot Exchange-Traded Fund (ETF) targeting the cryptocurrency, pushing its valuation to $35,000 before a brief dip.
Indeed, Bitcoin has reclaimed the $35,000 position, partly bolstered by the decision of the U.S. Federal Reserve’s Federal Open Market Committee (FOMC) to keep its benchmark fed funds rate range steady at 5.25%-5.50%.
Bitcoin price analysis
By press time, Bitcoin was changing hands at $35,366 with daily gains of over 2%. On the weekly chart, BTC is up almost 4%.
The expectation of Bitcoin rallying further is supported by several additional factors besides the ETF news. Specifically, the upcoming halving event and increasing demand amid geopolitical tensions are contributing to the positive outlook for the leading cryptocurrency.
Disclaimer: The content on this site should not be considered investment advice. Investing is speculative. When investing, your capital is at risk.


Comments
Post a Comment